Every website owner wants to maximize their site’s potential, but it’s not always obvious which metrics reflect the actual website’s performance. Researching reveals that some metrics matter more than others, but fortunately, there are ways to distinguish them and keep track of them.
If this topic interests you, you’re a website owner who wants to start measuring your website’s success or a marketer who wants to find new metrics to your arsenal. To do that, you first need to understand what metrics will best tell you how well your website performs.
In this HostPapa blog, we’ll explore eleven useful website metrics you should track on your own website.
How Metrics Can Impact Your Website’s Success
Metrics usually relate to a specific user’s activity or other sources that can benefit your marketing efforts. Metrics can also indicate issues with your website, a particular product web page or general performance.
Your website’s metrics tell a lot about your audience and content, so every marketer should know how and what metrics to highlight during their campaigns.
Likewise, metrics have another effect. Not only do they provide a way for users to identify what pain points they’re experiencing, but they also identify the parts of the system that work well. Together these details are incorporated into decision-making on marketing, website designs, and product offerings.

How Do I Start Tracking My Website Data?
We must note at that point that Google isn’t a one-way road for website analytics and tracking. A tool like Google Analytics can easily track your websites and provide valuable info for your marketing team. Numerous other third-party tools bring similar results. The likes of Hubspot, Smartlook, and Matomo are great options to consider and offer alternative views on tracking usable information from your visitors while respecting their anonymity.
You must have all your essential data in a central place. It’s also possible to use the Google Site Kit plugin to track stats on your WordPress website. After installing it, the plugin is available directly through your WordPress dashboard and connect it or use an online account manager to create one. Using this feature, you can access Google Analytics for content analysis.
You can check out our guides on how to use Google Analytics with WordPress and how to use Google Analytics on your website to track all the critical data we’ll note in this blog.
- Website Visitors
Before you gauge how attractive and engaging your website is, you’ll need visitors, so the first metric you should track is the number of site visitors. Traffic data is usually one of the first metrics you use for every marketing strategy telling you how these users found your site, among tons of other information.
If the number is too low, the other metrics covered in this article will have little value, so you need to boost your website traffic before getting reliable results.
You can create content that ranks on search engines to get more visitors to your website, something that’s called organic search traffic. And you can get backlinks, that is, links to your website posted on other popular websites with the same kind of audience you’re trying to attract.
You can also attract more visitors by running ad campaigns on Google Ads and following our top Facebook marketing tips to excel at social media.
If you already have a well-established website that gets a lot of traffic, you should measure the return visitors or repeat visitors metric. Returning visitors are those who have visited your website at least once. Having a lot of return visitors is important because it shows that your content is engaging.
If you don’t have many return visitors, you can:
- Create more engaging content like infographics and videos
- Add more products to your store or improve existing product pages with better copy, attractive product pictures, and videos
- Choose a more suitable demographic to target in your ad campaigns

Image credit: Kurve
- Bounce Rate
It happens all the time.
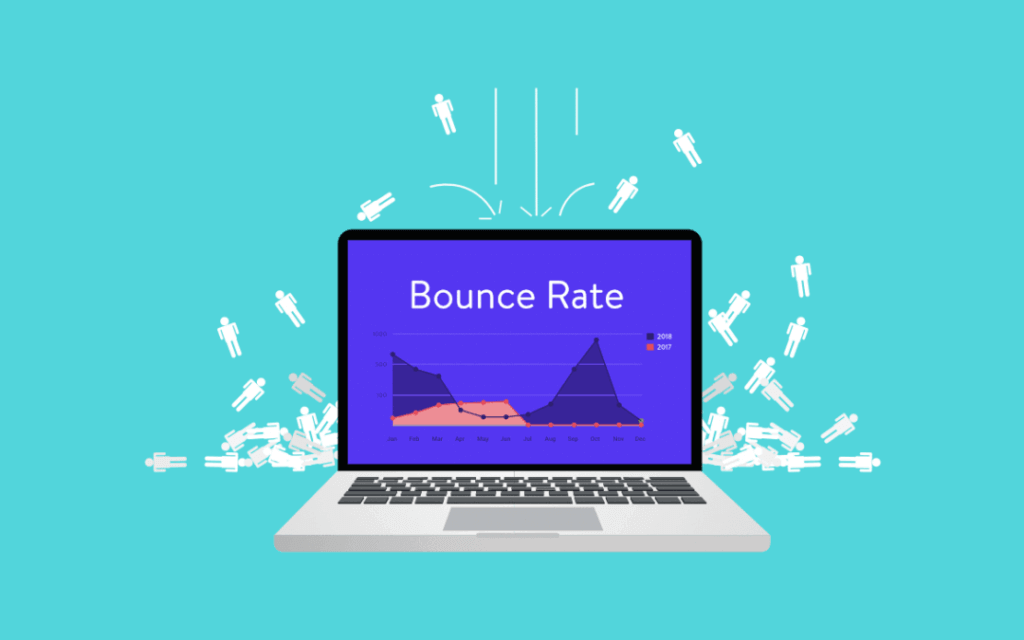
A person lands on a website from a search engine like Google. They look at the site and realize it doesn’t have the information, products, or services they’re looking for. So, they leave your website, adding to your website’s bounce rate!
There are multiple reasons why this happens. Maybe they think the site looks dull, or it’s just that people can’t find the information they’re after. In response, they click the back button on their browsers after a few seconds.
That is known as a visitor who has bounced. The ratio of the total website traffic to those who have bounced (left) is called a bounce rate.
A high bounce rate affects your SEO ranking and can make your site appear lower in search results, which can cause a significant drop in website traffic.
To tackle this issue, we must look at our bounce rate data. To do that, go to your Google Analytics page and find which web pages have the highest bounce rate.
Since the bounce rate is caused by a mismatch between visitor interest and the content on your website, there are three things you can do to improve it.
- You can enhance the content on your website so new visitors will be engaged and stay longer.
- You can refine your audience targeting to attract visitors interested in the products or services on your website.
- Read our in-depth analysis of how to reduce your website’s bounce rate.

Image credit: Bounteous
3. Average Pageviews per Session
If you want to know how engaging your website is, this is the metric to pay attention to. The average pageviews per session show precisely how many pages of your website a visitor has browsed.
For example, if you operate an eCommerce store, you want visitors to browse as many products as possible before eventually buying. If the average pageviews are five pages, you can assume that people typically look at three products per session – the first two pages are most likely the homepage and product category page.
To improve this metric, you must add as much compelling content to your website as possible. Usually, this means adding a “people also look at this” section based on the customer’s previous orders or by following other user behaviours.
One thing to remember is that a high average pageviews per session score doesn’t guarantee an increased number of subscribers or customers, but it’s a good indicator. The more pages visitors see on your website, the more likely they’ll take the action you want.
4. Average Session Duration
The average session duration metric is fairly simple. It calculates how much time a visitor was active on your website. Like the average pageviews per session, this metric is an excellent indicator of your website’s engagement. The more clicks your website gets, the higher this metric will be.
But remember that the average session duration isn’t reliable if your website isn’t based on interactions. If a user is inactive for 30 minutes or more, for example, the user isn’t clicking, Google Analytics will consider that their session has ended.
Suppose your website is focused on showcasing the products and services you sell and depends on people exploring its web pages and links. In that case, the session duration could be a more precise indicator of how attractive people find your website.
On the other hand, if you publish in-depth blog articles or super-long videos on your website, your visitors might only click a few pages. In that case, this metric wouldn’t be reliable for measuring engagement.
Generally speaking, though, session duration is a fantastic metric to track. The higher the number, the more people are likely to convert – boosting your conversion rate in the process.

5. Average Time on Page
This is another of the many website engagement metrics. If a site owner analyzes just the number of visitors and the average pageviews, they would only get one part of the story. A million people could land on a website, visit a few pages, and move on, uninterested in actually consuming the site’s content.
When considered with average session time, the metric that shows your actual engagement is the average time on the page.
The average time on page metric shows how much time is spent on your website’s pages. If you sell products, you’ll want people to look at product pages more than your landing page or product categories page.
The average time on page will let you know which kinds of pages visitors are spending more time on. This is particularly useful for content-heavy websites that depend upon visitors reading articles and watching videos.
6. Top Traffic Sources
There are places your website visitors come from, and we’re not talking about their hometowns! A traffic source shows from what medium your visitors come from. Is it a search engine, social media, email, or paid search? That can be answered by looking at your traffic sources in your analytics tool.
For example, if you have an active Instagram page promoting your website’s products or a YouTube channel where you create supplementary how-to videos, these are considered traffic sources. When many visitors come to your website from a particular source, that is one of your top traffic sources.
Why are traffic sources important?
Because they help make sense of other data on your website. For example, suppose your average session time is two minutes and 30 seconds. If you drill down and look at the traffic source associated with that session time data, you’ll get some precious insight.
Your average session time from newsletter subscribers might be three minutes and 15 seconds, while the one from Facebook might be just 30 seconds.
By looking at the average session time per traffic source, you found that your email subscribers love engaging with your website more than visitors from Facebook.
Using this information, you’ll be able to act more effectively on the data provided in Google Analytics or other tracking tools.
The “average” metrics in Google Analytics, for instance, average time on screen, average pageviews, and average session duration are averages of averages. So they’re not very reliable on their own.
They are valuable, but you need to use them in tandem with other metrics, like traffic sources, for them to make much more sense. When combined with other metrics, these “averages” can help you determine where your website’s engagement is coming from.

Image credit: hochzeitskleidyear
7. Device Source
Device source is another metric you can use as input when trying to make your website more engaging.
This metric can be used to find the top device types (PC, tablet, or smartphone) people use to access your website. In addition, you can see the top operating systems (iOS, Android, Windows, and macOS) and top browsers (Chrome, Safari, Firefox, and Edge) being used to render your site.
Knowing this will allow you to optimize your website for the kind of devices it’s being accessed from. Looking at the current landscape, it’s fair to say that most people use their smartphones a lot when browsing online, which means you must pay as much attention to them as desktop users.
Thankfully, designing and checking if your website is mobile-friendly is a more straightforward process than you would expect, and all you need to do is read our guide on how to make a mobile-friendly website.
You’ll be able to make changes to the design and content so that your site looks great on the devices most commonly used to access it. Device source data comes in handy when creating ad campaigns. Some campaigns might favour smartphones rather than desktops and vice versa.

Image credit: Platform
8. Interactions per Visit
The interactions per visit metric is another fantastic metric you should monitor on your site. It shows how visitors are moving across your website, again giving you an in-depth look at which parts of your website are engaging and which aren’t.
For example, in an online store, you can see which product category page people visit the most or the least. Knowing this will tell you what kind of products your visitors are interested in seeing. This is excellent when planning your next shipment, as you’ll know precisely what drives people to your online store.
The interactions per visit metric also let you see the exact link, button, or other interactive elements a visitor has clicked and what action they took, for instance, what they liked, bought, commented on, or subscribed.
All this data can be helpful when planning your content or marketing strategies for increasing your sales and subscriptions or simply boosting engagement. Artkai helps to build predictably successful products that matter. Helps in selecting strategies to develop and improve company performance and building digital products that make sense.
9. Exit Pages and Top Exit Pages
Many sites have a multi-step conversion process. For example, if you’re selling products via content marketing, you’ll first want visitors to read an article based on that product. Then you’ll want them to go to your eCommerce store and buy that product. Maybe you also want them to subscribe to your blog to learn more about the next exciting product your company sells.
Your visitors may have to click on a purchase link via email and fill out a form, among other things.
In an eCommerce store, visitors may have to search for an item via the search bar or an extensive product category menu, click the checkout button, complete the checkout form, and pay for the item. This user journey includes multiple pages, but it can have some issues.
Visitors can fall out of touch at any point in a process with multiple pages like this. It may be because the entire process needs to be simplified or because the visitor changed their mind regarding the product they’re buying.
Before improving in this area, you need to know which of your website’s pages are exit pages: pages where people are abandoning your website.
Although exit pages have a lot in common with the bounce rate that we discussed earlier. If you’re an eCommerce store owner, some exit pages, like a “thank you for your purchase” or “thanks for contacting,” are expected and don’t count towards your bounce rate.
If a visitor goes through four or five web pages before leaving your website, the last page they visited will count towards your exit page rate. Google thoroughly explains the subject and how it differs from the bounce rate discussed earlier.
This way, you’ll be able to pinpoint what part of your website you need to improve to enhance engagement or reduce friction.

10. Conversion Rate
Perhaps the final goal for your website is to make sales or reach perform a specific action on your website. Some relevant actions include subscribing to a newsletter, completing a survey, and filling out a website form. This is precisely what the conversion rate metric shows us.
More specifically, the conversion rate displays the percentage of people who complete a specific task or action on your website. You can evaluate your conversion rate by looking at your call-to-action buttons (CTAs) and their placement on your landing pages.
There are multiple types of landing pages, and we have a separate article describing precisely what you need to improve your landing page content for higher conversion rates.
Your conversion rate isn’t driven entirely by your content but also by the website’s design and structure. By ensuring your website is well-designed with clean landing pages and CTAs, you’re creating the basis to increase conversions and boost your sales.
Bonus: Event Tracking
All metrics matter. And while all the information you get from the tracking tools is a goldmine, you should also know how to fill the gaps between them, painting a clearer picture of how your website’s doing.
That’s where event tracking comes in handy. Event tracking is probably one of the most crucial website metrics, leveraging custom events that most tracking tools don’t measure. For instance, in Google Analytics, you can label each event to a specific category, action, or value, which will log it according to the visitors’ choices.
Final Thoughts
The trick to using these metrics properly is to identify which can help you assess whether your website is meeting the needs of your business or lacks behind your competition.
If you try to measure all metrics at once without any purpose, you’ll quickly become overwhelmed and obsessed with improving the numbers in your Google Analytics dashboard without a clear motive.
Instead, focus on generating insights from the metrics you’re measuring – insights you can convert into actions to improve your site’s user experience.
Generally speaking, most of these measures can be improved using three tactics:
- Ensuring content relevancy. Make sure you cover the topics your users expect to find on your page according to their search intent.
- Optimizing technical SEO aspects, such as Page Speed, image and code optimization.
- Having a cohesive, intuitive design.
While you can find a wide range of information on the first two, we noticed that the third is often overlooked by small business owners just starting out.
Which metrics are you tracking on your website? Are you using specialized tracking tools that measure different website metrics?


