To view your Managed WordPress logs, open your Managed WordPress Dashboard, choose your website, and click the Monitoring tab. You’ll find your logs in three sub-tabs: Origin for your server’s own messages, Edge for every request that reached the network, and Security for firewall activity. Logs cover the last 30 days.
This Knowledge Base article explains how to view the logs for a WordPress site that was created with your Managed WordPress service.
Logs are the running record of what’s happening on your site. They’re the first place to look when something goes wrong, like an error page or a plugin misbehaving, and they’re also where you’ll see what your site’s security is blocking.
Which Log Should You Check?
| Question | Sub-tab |
| Why is my site erroring? | Origin, your server’s own messages |
| Did visitors actually reach this page, and was it cached? | Edge, every request as the network saw it |
| What’s being blocked? | Security, firewall decisions |
Origin Logs: Your Server’s Own Messages
The Origin sub-tab shows messages from your own site’s server, both the web server and PHP. This is where to look when you’re diagnosing errors like a blank page or a “500” error.
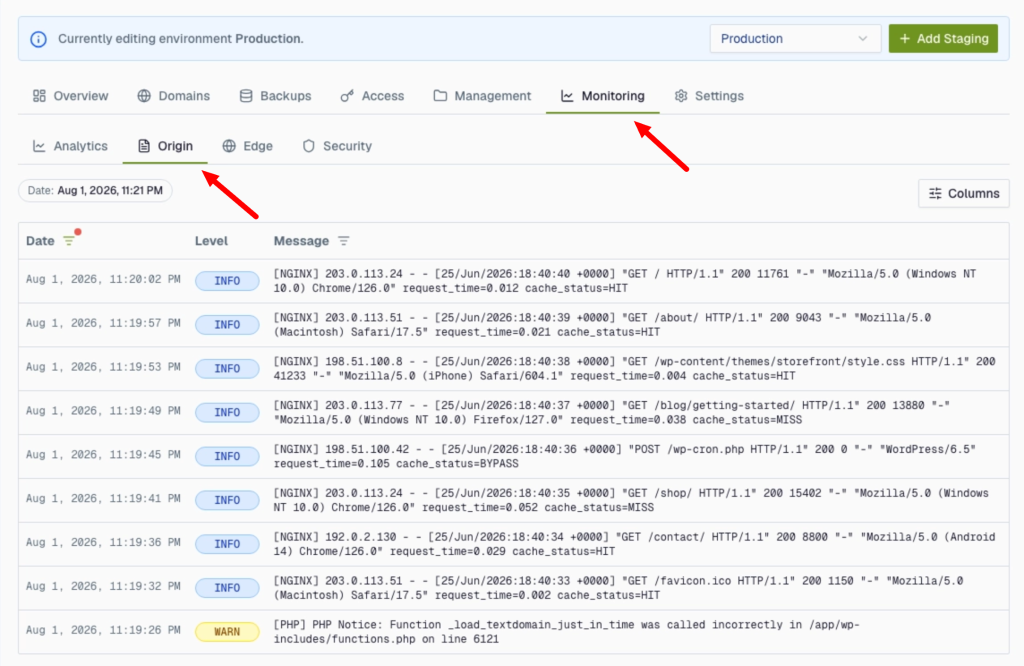
- Each line shows a colour-coded level (ERROR in red, WARN in orange, INFO in blue), a timestamp, and the message.
- Use the search box to filter to a word or phrase, and the direction toggle to show newest- or oldest-first.
- To investigate a problem, note roughly when it happened and look for ERROR/WARN lines around that time.
Edge Logs: Every Request That Reached the Network
The Edge sub-tab lists the requests arriving at the network in front of your site, whether or not they ever reached your server.
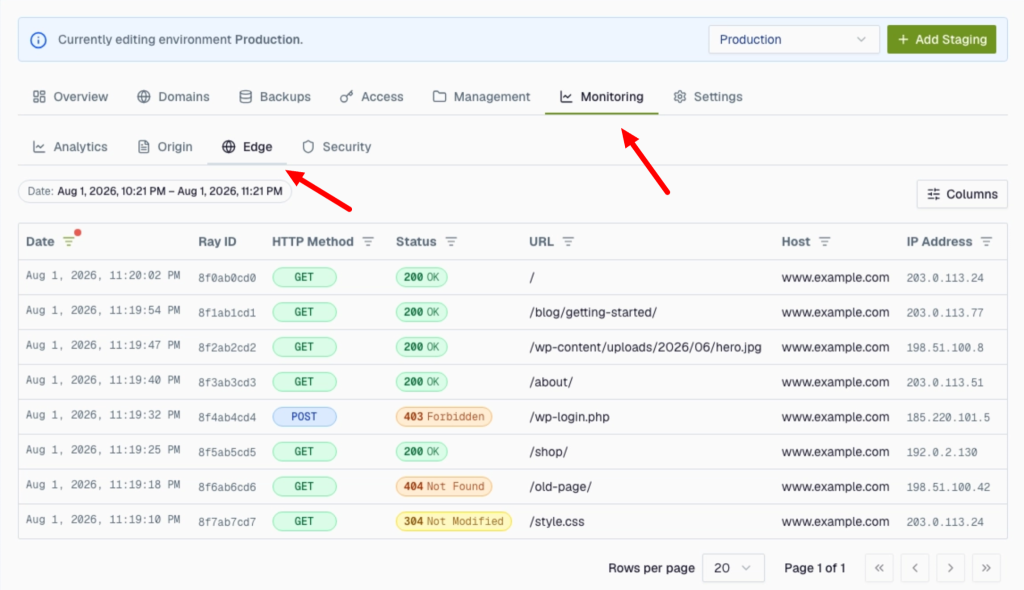
- Each line shows the date and time, the method (GET, POST…), the status (200 OK, 404 Not Found, 403 Forbidden…), the URL requested, the host, and the visitor’s IP address. The Ray ID is the network’s reference for that single request, so quote it if you contact support about one.
- Use the Columns button (top right) to add Cache Status, Data Centre, and Response Size. Cache Status is the one worth switching on: hit means the page was served straight from the network, so it’s fast and your server never saw the request. A miss or dynamic result means the request went through to your site.
- Use the date range at the top to narrow to when the problem happened, and the column filters to focus on one status code or path.
- This is where to look when a page loads for you but not for a visitor, when you want to confirm a redirect is working, or when you’re checking that caching is actually doing its job.
Use Edge alongside Origin. If a request appears here with a 500 status, the matching Origin line usually tells you why.
Security Logs: What the Firewall Did
The Security sub-tab shows security events from the Cloudflare edge protecting your site. For example, requests that were blocked or challenged by the web application firewall (WAF).
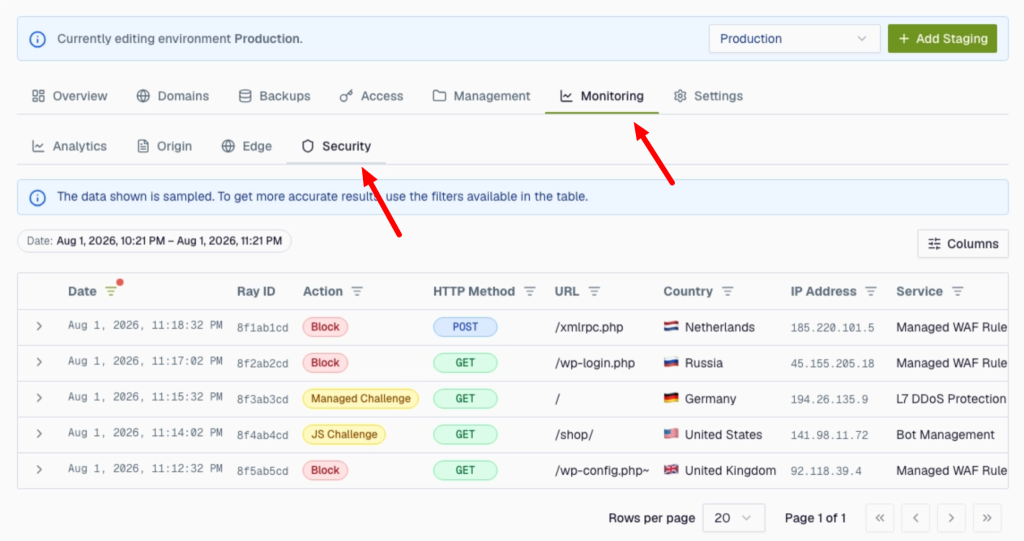
- Each event has an action badge: BLOCK, CHALLENGE (and JS/managed challenge), ALLOW, LOG, or SKIP.
- Allowed traffic is hidden by default, so this tab normally shows only the events where the firewall stepped in. An empty Security tab usually means nothing was blocked, which is good news. To see allowed traffic too, set the action filter to ALLOW.
Good to Know
- Logs cover the last 30 days.
- An empty Origin tab usually just means there were no log lines in the time window you’re viewing.
- Edge shows the most recent requests for the range you pick while busy sites will show only the latest, so narrow the range when you’re looking for something specific.
If you need help with your HostPapa account, please open a support ticket from your dashboard.