HostPapa VPS users have several tools at their fingertips for monitoring server performance. If you want to check your VPS memory usage, you can choose to monitor resources using WHM or the command line. In this article, we’ll show you how to use both methods.
Check memory usage with WHM
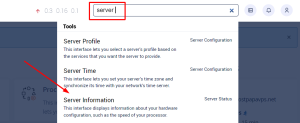
To check your VPS memory usage with WHM, log in to WHM and type “server” in the search bar. Select Server information under Server Status.

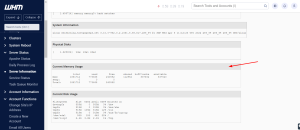
Scroll down to the Current Memory Usage section.

Check memory usage using the command line
You can also log in to your server using a Secure Shell (SSH) and use various commands to track VPS memory usage. To find out more about accessing your server using SSH, check out this Knowledge Base article: How to connect to your server via Secure Shell (SSH).
Once you’ve logged in, try the following commands:
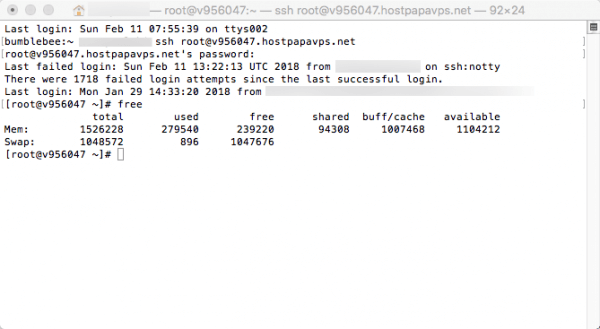
Free
This quick and easy tool displays the amount of free memory available. The report includes physical and swap memory, plus buffers used by the kernel.
- Total: the amount of physical swap RAM available
- Used: RAM consumed by the server and its processes
- Free: RAM available for the system to use
- Shared, buffers and cache: memory currently used by the kernel
You can change the measurement units displayed on the screen by adding -m (megabytes) or -g (gigabytes) after the command.
Note: If you notice your Free memory is low, the server may be using available RAM for cache. This can be released when required by the system.
vmstat
The vmstat command displays current virtual memory usage- processes, memory, paging, disks, and CPU information.
The data table displayed can be overwhelming at first. It’s split into six columns – procs (processes), memory, swap, io, system, and cpu. Let’s take a look at each of these columns:
- Procs displays information about processes. The r column shows the number of running processes (or those waiting for run time), while the b columns indicate sleeping processes.
- Memory is split into four columns. swpd displays virtual memory used, while free shows idle memory. buff and cache display memory the system has allocated to buffers and cache.
- Swap details the amount of data swapped to and from the disk each second. si shows data swapped to the disk while so corresponds to data swapped from the disk.
- IO allows you to monitor input/output statistics from your drives. bi corresponds to input, while bo reports data sent to the drive.
- System consists of two columns. in reports the number of system interrupts per second and cs corresponds to context switches.
- CPU has five columns. us reports usage by user-launched code (rather than system processes), and sy reports usage by the system kernel. id corresponds to idle CPU time, wa is time spent waiting for Input/Output, while st shows the processing time stolen from a virtual machine.
ps
The ps command reports the processes currently launched on the server.
You can add a range of parameters to the command to report on a variety of statistics:
- -e: display processes from all users.
- -o: display statistics in a custom format. Combine with values such as pmem (percentage memory usage), vsz (virtual memory allocation), and others to create more complex queries.
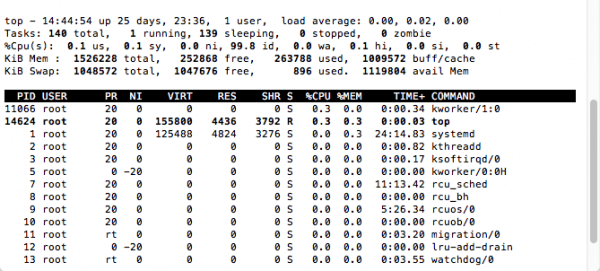
top
The top (or htop) command supports real-time monitoring of server resource usage.
Use the h or ? keys, once running, to display the help menu. The m key toggles memory-related information while Shift + M sorts processes by memory usage. Press q to stop monitoring.
If you need help with your HostPapa account, please open a support ticket from your dashboard.


