The Analytics view shows how much traffic your site is getting — visits, requests, and bandwidth over time — and where your visitors come from. The numbers are measured at the network edge (Cloudflare), in front of your site, so they include all traffic.
What you’ll see
The Analytics view on the Monitoring tab
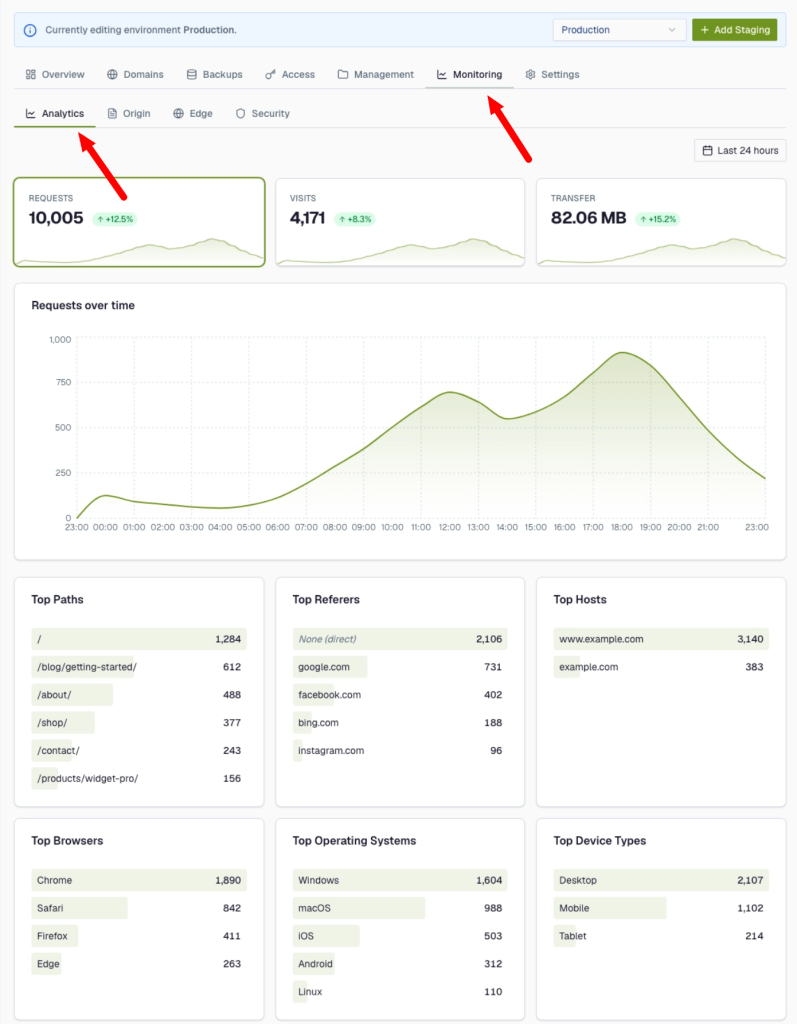
- Summary cards for Requests, Visits, and Transfer (bandwidth), each with an up/down arrow comparing to the previous period.
- A Requests over time chart.
- Top breakdowns: most-visited pages (Paths), where visitors came from (Referers), Countries, Browsers, Operating Systems, Device Types, status codes, and cache hit rates.
- A date-range picker (up to the last 30 days). Changing the range refreshes everything.
- Hovering a chart shows a crosshair with the value at that moment, lined up across the charts. To zoom into a busy period, drag across the chart to select it.
What the numbers mean
- Requests — every file fetched (one page view is usually several requests). A measure of total load.
- Visits — distinct visitor sessions; the closest thing to “how many people came.”
- Transfer — total data served; useful for understanding bandwidth use.
- Cache statuses — how much was served from the fast edge cache vs. fetched from your site.
Analytics is read-only — looking at it never changes anything on your site.