MTR Traceroute is a network diagnostic tool that combines the functionality of ping and traceroute. It continuously sends packets to a specified host, measuring the response time and packet loss at each hop along the network path. This provides a dynamic view of network performance and helps pinpoint where latency or packet loss may be occurring.
When to use My Traceroute
MTR (My Traceroute) is particularly useful for:
- Diagnosing network connectivity issues.
- Identifying bottlenecks or points of congestion.
- Troubleshooting slow network performance.
- Monitoring network health over time.
How to Install MTR Traceroute
Windows
In Windows, MTR My Traceroute is often implemented by tools like WinMTR.
- Download WinMTR: Go to the official WinMTR website or a trusted software download site to get the latest version: https://winmtr.net/
- Installation: WinMTR is often a standalone executable and does not require a formal installation process. Simply extract the downloaded archive (if it’s a ZIP file) to a folder of your choice. More details can be found here: http://winmtr.com/#Installing%20and%20Running%20WinMTR
macOS
MTR Traceroute can be installed on macOS using Homebrew, a popular package manager.
- Install Homebrew (if not already installed): Open Terminal (Applications > Utilities > Terminal) and run:
| /bin/bash -c “$(curl -fsSL https://raw.githubusercontent.com/Homebrew/install/HEAD/install.sh)” |
- Install MTR My Traceroute: Once Homebrew is installed, run:
| brew install mtr |
Linux
On Red Hat-based systems (like CentOS or RHEL), use yum or dnf.
- Install MTR (My Traceroute):
| sudo yum install mtr |
or
| sudo dnf install mtr |
How to Run an MTR Traceroute Test
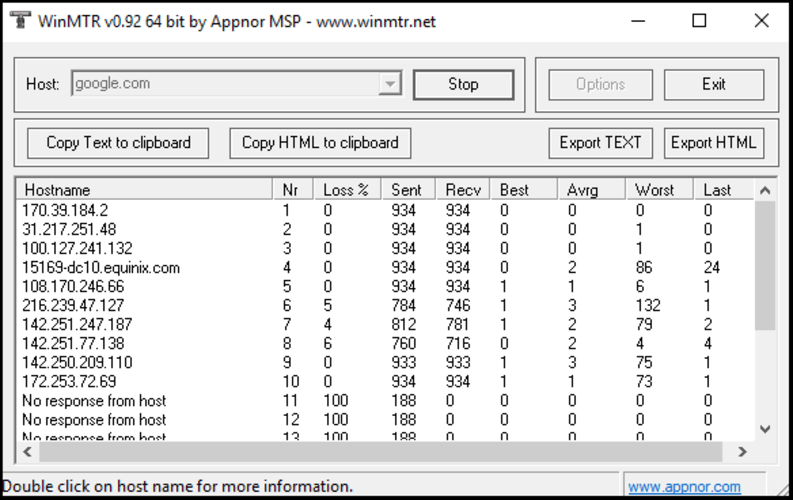
Windows (using WinMTR)
- Open WinMTR: Navigate to the folder where you extracted WinMTR and double-click WinMTR.exe.
- Enter Hostname/IP: In the Host field, enter the IP address or hostname of the target server you want to test (for example, google.com or 8.8.8.8).
- Start Test: Click the Start button.
- Observe Results: WinMTR continuously updates results, showing hops, packet loss percentage, and latency metrics (Last, Avg, Best, and Wrst).
- Stop Test: To stop, click the Stop button.
- Export Results (Optional): You can export the results to a text or HTML file using the Export TEXT or Export HTML buttons for sharing.
macOS and Linux (using Terminal)
- Open Terminal:
- macOS: Applications > Utilities > Terminal.
- Linux: Open your preferred terminal application.
- Run My Traceroute command: In the terminal, use the mtr command followed by the target hostname or IP address.
| mtr -r -n -c 1000 <target_hostname_or_IP> |
For example:
| mtr -r -n -c 1000 google.com |
or
| mtr -r -n -c 1000 8.8.8.8 |
3. Stop MTR Traceroute: Press Ctrl+C to stop the My Traceroute test.
Interpreting MTR Traceroute Results
- High Loss% at a specific hop, but not subsequent hops: This result often indicates an issue with that particular router (for example, it’s dropping ICMP packets, or there’s congestion at that point).
- High Loss% starting at a specific hop and continuing through subsequent hops: This outcome often points to a problem with the network link before or at that first hop where the loss began.
- High Avg (Average) latency that increases at a specific hop and remains high: This result suggests a bottleneck or congestion at or after that hop.
- High Wrst (Worst) latency that is much higher than Avg and Best: This outcome can indicate intermittent network issues or sudden bursts of traffic.
If you need help with your HostPapa account, please open a support ticket from your dashboard.