Web server logs are records produced by your server; they provide a detailed account of all events occurring in your website logging and the website’s functionality, including system errors, potential security threats like failed login attempts, and performance issues.
If you’re experiencing problems with your site, with specific users, your database, or you simply wish to review your traffic, the cPanel can grant you access to your site logs.
Understanding Web Server Logs
Web server logs record every request made to the server, including IP addresses, URLs accessed, HTTP responses, and user agents.
By analyzing this log entry information, you can identify potential issues, optimize website performance, and ensure a secure online presence.
Reviewing Raw Server Logs
Reviewing raw access logs is a crucial way to maintain security and performance; these allow you to see who has visited your website.
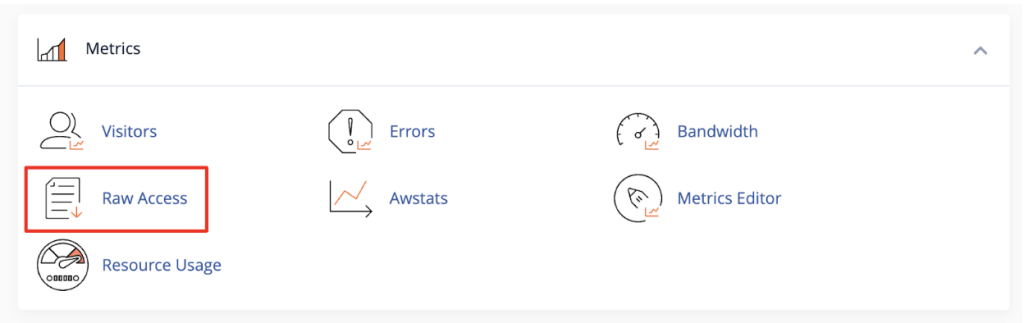
To access them, first log in to your cPanel (control panel) and take a look at the Metrics menu. You’ll see a selection of available analytics tools that can provide insight into your website logging, error logs, site’s traffic, and more.
To review the source log files in your account, go to Metrics and click on Raw Access.
Managing Log Files
By default, log files are archived in the Home directory on your server every 24 hours and subsequently removed at the end of the month to optimize storage space. However, you can adjust these options using the checkboxes under Configure Logs.
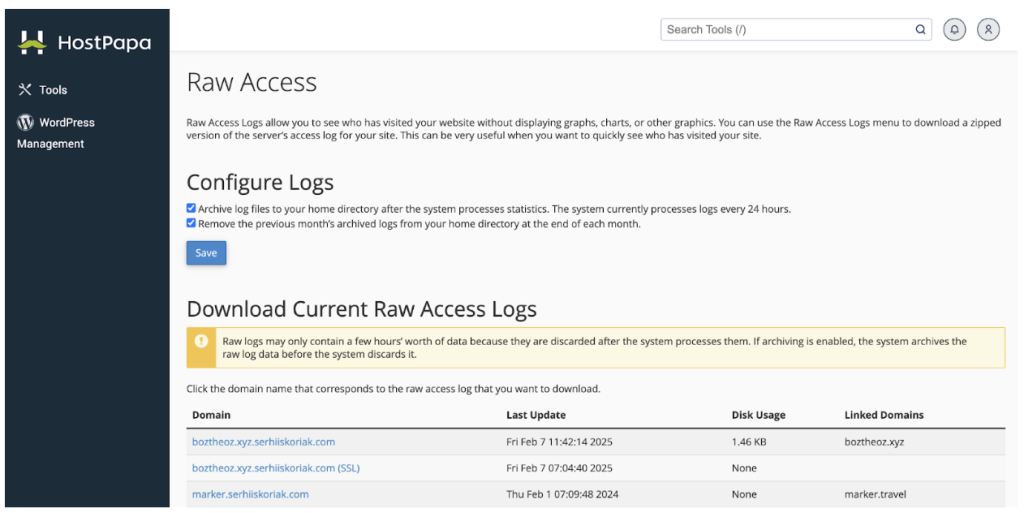
Further down the page, under Download Current Raw Access Logs, your domains and subdomains are listed, with links to the most recent log files.
Under domain, you will be able to download the log file you select. You will need to extract the compressed log file using 7-zip or an alternative archiving tool.
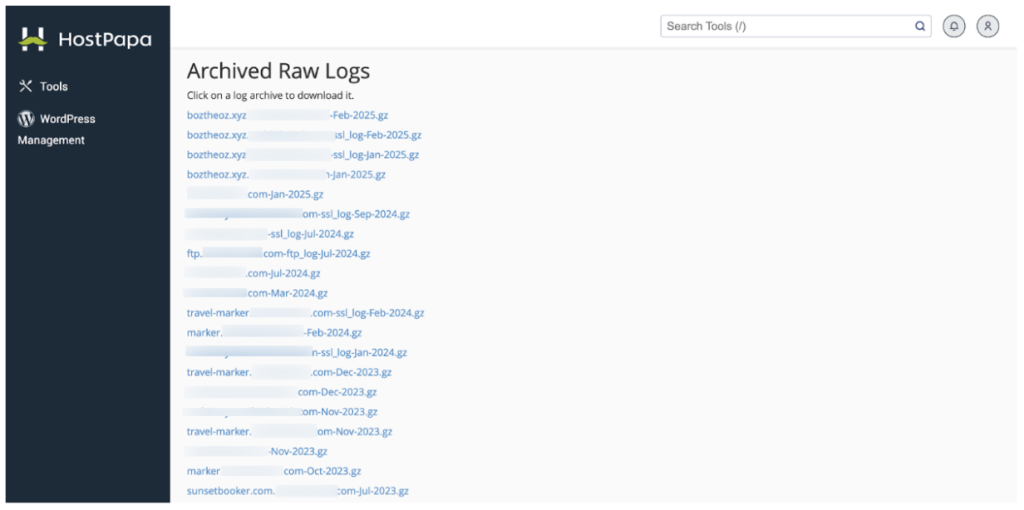
Near the bottom of the page, you’ll find a list of Archived Raw Logs. Again, simply click the links to download the log files from your server. Once extracted, you can open the log files in any modern text editor.
Understanding Log Data
Logged visits include several key pieces of information that are invaluable for understanding your website’s traffic and performance. This allows you to understand user roles, access data, general website errors, and more.
- The visitor’s IP address: This shows where the request originated.
- The date and time of the visit: Knowing when your site is accessed can provide insights into peak traffic times.
- The type of HTTP request sent by the visitor’s browser (GET or POST): This indicates what the visitor is trying to do on your site.
- A relative path to a file/image/query and HTTP version: This records the specific resources accessed on your site to monitor which pages are most popular.
- The status of the request: For example, 404 – not found (usually indicating broken links, 200 – success. This is crucial for identifying errors and ensuring that your site is performing as expected.
- The identity and credentials of the user-agent: This provides information about the browser and operating system used by the visitor.
If you’re interested in finding analysis tools to know valuable insights on log data, load times, event logs, and statistics; get to know the AWStats statistics software in this article.
By understanding and effectively managing web server logs regularly, website owners can ensure a secure, compliant, and high-performing website.
If you notice any problems in your core website files or if you need any help to monitor and analyze logs, please open a new support ticket from your HostPapa Dashboard. More details on how to open a support ticket can be found here.