Your HostPapa Web Hosting account shares a finite amount of resources that are available for use at any given time by all users on that shared server. The HostPapa system administrators monitor individual accounts on the server for excessive use.
How to view your current usage in real-time:
To view your website’s current resource usage stats, follow these simple steps:
Note: displays may vary slightly depending on your server
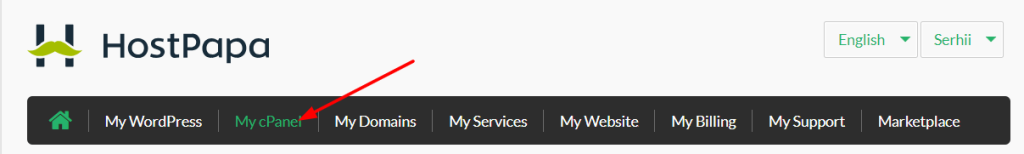
- Log in to your HostPapa Dashboard.
- Click on My cPanel.
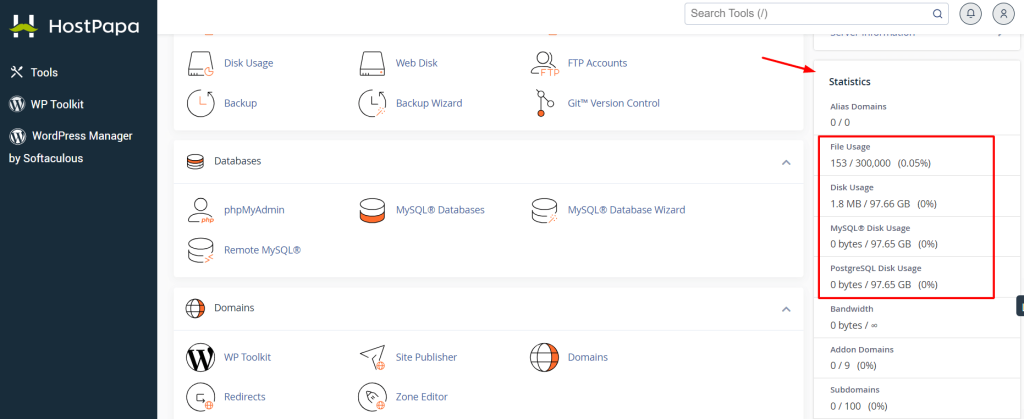
- Scroll down and look for the Statistics section at the right side of your screen. There, you’ll see your website’s current, real-time resource usage.
How to view your resource usage history:
To view your website’s past resource usage stats, follow these steps:
Note: displays may vary slightly depending on your server
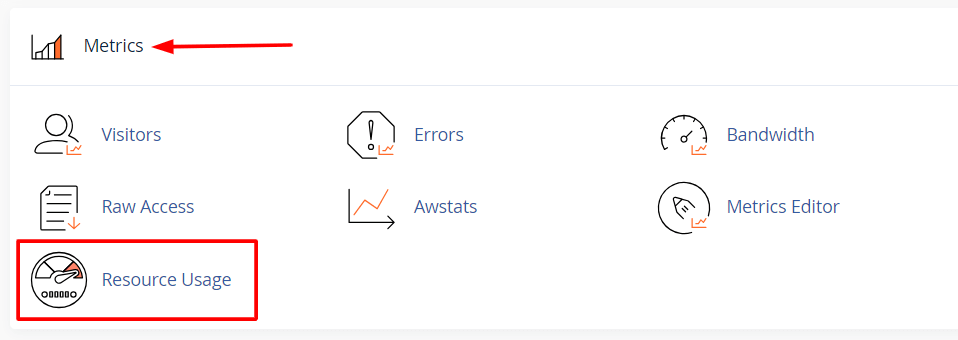
- Scroll down to the Metrics section.
- Click Resource Usage.
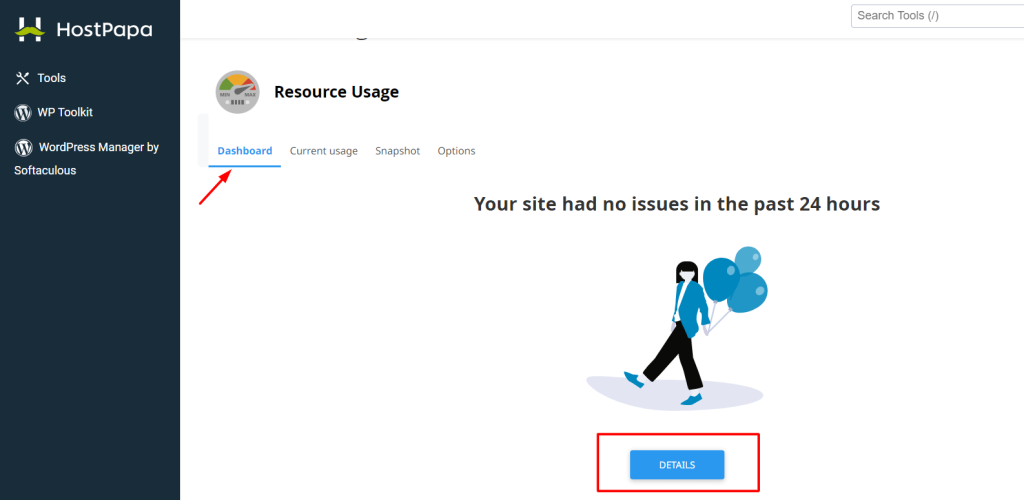
- In the Dashboard section, click on Details.
- Scroll down to select a Timeframe from the drop-down.
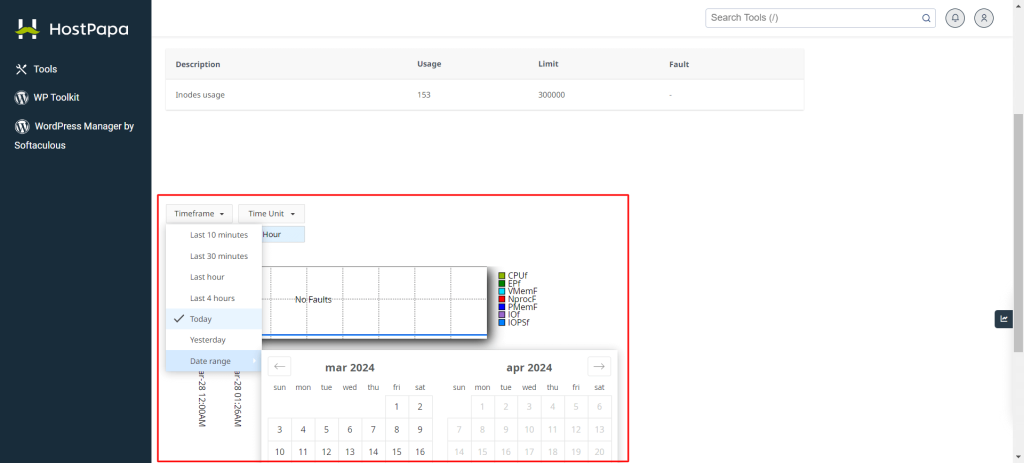
- You will see diagrams and tables showing detailed usage statistics
Legend:
CPU – CPU limits
vMEM/vM – Virtual Memory limits
pMEM/pM – Physical Memory limits
EP – Entry Processes
nPROC/nP – Number of Processes
IO – Input/Output limits
average/a – average used
limit/l – limit set for account
max/m – maximum used
f – failure
If you need help with your HostPapa account, please open a support ticket from your dashboard.